draw_vector(ncfile, values, varn)
Function to plot wind vectors
ncfile= file to use
values= [dimname]|[vardimname]|[value]:[dimxyfmt]:[vecvals]:[windlabs]:[mapvalues]:[gtit]:[kindfig]:[figuren]:
[closefig]
'X/Y/Z/T'|[dimname]|[vardimname]|[value]: ',', list for each basic dimension '|' separated of:
[dimname]: name of the dimension in the file
[vardimname]: name of the variable with the values for the dimension in the file
[value]: which value of the given dimension is required:
* [integer]: which value of the dimension
* -1: all along the dimension
* -9: last value of the dimension
* [beg]:[end] slice from [beg] to [end]
* NOTE, no dim name all the dimension size
No value takes all the range of the dimension
[dimxyfmt]=[dxs],[dxf],[Ndx],[ordx],[dys],[dyf],[Ndy],[ordy]: format of the values at each axis ('auto', for
'pretty' at both axes)
[dxs]: style of x-axis ('auto' for 'pretty')
'Nfix', values computed at even 'Ndx'
'Vfix', values computed at even 'Ndx' increments
'pretty', values computed following aprox. 'Ndx' at 'pretty' intervals 2.,2.5,4,5,10)
[dxf]: format of the labels at the x-axis
[Ndx]: Number of ticks at the x-axis
[ordx]: angle of orientation of ticks at the x-axis ('auto' for horizontal)
[dys]: style of y-axis ('auto' for 'pretty')
[dyf]: format of the labels at the y-axis
[Ndy]: Number of ticks at the y-axis
[ordy]: angle of orientation of ticks at the y-axis ('auto' for horizontal)
[vecvals]= [frequency],[color],[length]
[frequency]: [xfreq]@[yfreq] frequency of values allong each axis ('None', all grid points;
'auto', computed automatically to have 20 vectors along each axis)
[color]: color of the vectors
'singlecol'@[colorn]: all the vectors same color ('auto': for 'red') and lengths according to wind's module
'wind'@[colorbar]@[sminv]|[smaxv]: color of the vectors according to wind speed sqrt(u^2+v^2)
and given [colorbar] all vectors the same length
[smin/axv]: minimum and maximum value for the shading or:
'Srange': for full range
'Saroundmean@val': for mean-xtrm,mean+xtrm where xtrm = np.min(mean-min@val,max@val-mean)
'Saroundminmax@val': for min*val,max*val
'Saroundpercentile@val': for median-xtrm,median+xtrm where xtrm = np.min(median-percentile_(val),
percentile_(100-val)-median)
'Smean@val': for -xtrm,xtrm where xtrm = np.min(mean-min*@val,max*@val-mean)
'Smedian@val': for -xtrm,xtrm where xtrm = np.min(median-min@val,max@val-median)
'Spercentile@val': for -xtrm,xtrm where xtrm = np.min(median-percentile_(val),
percentile_(100-val)-median)
'3rdvar'@[colorbar]@[varn]@[units]@[sminv]|[smaxv]: color of the vectors according to a 3rd variable
(to be added at -v) and given [colorbar] all vectors the same length
[colorbar]: name of the colornbar to use
[varn]: name of the variable to pick up values
[units]: units of the variable
[sminv]|[smaxv]: minimum and maximum value for the shading or:
'Srange': for full range
'Saroundmean@val': for mean-xtrm,mean+xtrm where xtrm = np.min(mean-min@val,max@val-mean)
'Saroundminmax@val': for min*val,max*val
'Saroundpercentile@val': for median-xtrm,median+xtrm where xtrm = np.min(median-percentile_(val),
percentile_(100-val)-median)
'Smean@val': for -xtrm,xtrm where xtrm = np.min(mean-min*@val,max*@val-mean)
'Smedian@val': for -xtrm,xtrm where xtrm = np.min(median-min@val,max@val-median)
'Spercentile@val': for -xtrm,xtrm where xtrm = np.min(median-percentile_(val),
percentile_(100-val)-median)
[length]: length of the wind vectors ('auto', for 9)
[windlabs]= [windname],[windunits]
[windname]: name of the wind variable in the graph
[windunits]: units of the wind variable in the graph ('None', for the value in the file)
[mapvalues]= map characteristics: [proj],[res]
see full documentation: http://matplotlib.org/basemap/
[proj]: projection
* 'cyl', cilindric
* 'lcc', lambert conformal
[res]: resolution:
* 'c', crude
* 'l', low
* 'i', intermediate
* 'h', high
* 'f', full
gtit= title of the graph ('!', for spaces)
kindfig= kind of figure
figuren= name of the figure
closefig= whether the figure should be closed
ncfile= file to use
varns= [uwind],[ywind] ',' list of the name of the variables with the u-wind,y-wind component
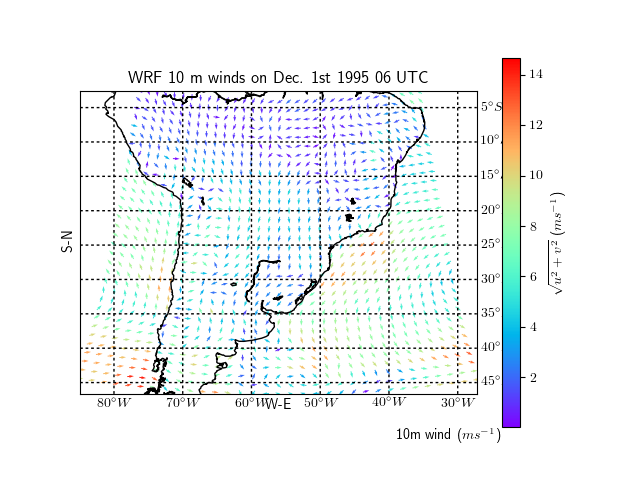
$ python ${pyHOME}/drawing.py -o draw_vectors -f ~/PY/wrfout_d01_1995-01-01_00:00:00 -S 'T|Time|Times|2,Y|south_north|XLAT|-1,X|west_east|XLONG|-1:auto:3@3,wind@rainbow@Srange|Srange,9:10m wind,ms-1:cyl,l:WRF!10!m!winds!on!Dec.!1st!1995!06!UTC:png:winds:yes' -v U10,V10
$ python ${pyHOME}/drawing.py -o draw_vectors -f ~/PY/wrfout_d01_1995-01-01_00:00:00 -S 'T|Time|Times|2,Y|south_north|XLAT|-1,X|west_east|XLONG|-1:auto:3@3,singlecol@red,9:10m wind,ms-1:cyl,l:WRF!10!m!winds!on!Dec.!1st!1995!06!UTC:png:winds:yes' -v U10,V10
$ python ${pyHOME}/drawing.py -o draw_vectors -f ~/PY/wrfout_d01_1995-01-01_00:00:00 -S 'T|Time|Times|2,Y|south_north|XLAT|-1,X|west_east|XLONG|-1:auto:3@3,3rdvar@BuPu@huss@kgkg-1@0.|0.02,9:10m wind,ms-1:cyl,l:WRF!10!m!winds!&!huss!on!Dec.!1st!1995!06!UTC:png:winds:yes' -v U10,V10,Q2