Plotting a series of lon, lat, labels kept in an ASCII file with the option to add a shaded field
Function to plot a series of points read from an ASCII file with lon, lat, label
draw_points(filen, values)
draw_points(filen, values)
[values]= [ptasciifile]:[gtit]:[dimxyfmt]:[mapvalues]:[kindfigure]:[pointcolor]:[pointlabels]:
[legvals]:[figureko]:[figuren]:[close]
[ptasciifile]:[file],[comchar],[collon],[collat],[lab]
[file]: column ASCII file with the location of the points
[comchar]: '|' list of characters for commentaries
[collon]: number of column with the longitude of the points
[collat]: number of column with the latitude of the points
[collab]: number of column with the labels of the points ('None', and will get
the values from the [pointlabels] variable
[gtit]: title of the figure ('|' for spaces)
[dimxyfmt]: [dxs],[dxf],[Ndx],[ordx],[dys],[dyf],[Ndy],[ordx]: format of the values at each axis (or 'auto')
[dxs]: style of x-axis ('auto' for 'pretty')
'Nfix', values computed at even 'Ndx'
'Vfix', values computed at even 'Ndx' increments
'pretty', values computed following aprox. 'Ndx' at 'pretty' intervals (2.,2.5,4,5,10)
[dxf]: format of the labels at the x-axis ('auto' for '%5g')
[Ndx]: Number of ticks at the x-axis ('auto' for 5)
[ordx]: angle of orientation of ticks at the x-axis ('auto' for horizontal)
[dys]: style of y-axis ('auto' for 'pretty')
[dyf]: format of the labels at the y-axis ('auto' for '%5g')
[Ndy]: Number of ticks at the y-axis ('auto' for 5)
[ordy]: angle of orientation of ticks at the y-axis ('auto' for horizontal)
[mapvalues]: drawing coastaline ([proj],[res]) or None
[proj]: projection
* 'cyl', cilindric
* 'lcc', lambert conformal
[res]: resolution:
* 'c', crude
* 'l', low
* 'i', intermediate
* 'h', high
* 'f', full
[kindfigure]: kind of figure
'legend': only points in the map with the legend with the names
'labelled',[txtsize],[txtcol],[txtbckgcol]: points with the names and size, color of text and background
color ('None' for without)
[pointcolor]: color for the points ('auto' for "red")
[pointlabels]: ',' of labels [only used if [collab]='None'] ('None' for no labels, '!' for spaces)
[legvals]=[locleg]|[fontsize]:
[locleg]: location of the legend (0, autmoatic)
1: 'upper right', 2: 'upper left', 3: 'lower left', 4: 'lower right',
5: 'right', 6: 'center left', 7: 'center right', 8: 'lower center',
9: 'upper center', 10: 'center'
[fontsize]: font size for the legend (auto for 12)
[figureko]: kind of the output file (pdf, png, ...)
[figuren]: name of the figure
[close]: Whether figure should be finished or not
[filen]= [ncfile],[lonvarn],[latvarn][,[varn],[dimvals],[vargn],[min],[max],[colbarn],[fmtcolorbar],[orientation],[varu]]
[ncfile]: netCDF to use to geolocalize the points
[lonvarn]: name of the variable with the longitudes
[latvarn]: name of the variable with the latitudes
Optional values:
[varn]: optional variable to add staff into the graph
[dimval]: '@' list of [dimn]|[dimval] to get the values for [varn]
[dimn]: name of the dimension
[dimval]: value of the dimension variable a given value is required:
* [integer]: which value of the dimension
* -1: all along the dimension
* -9: last value of the dimension
* [beg];[end];[inc] slice from [beg] to [end] every [inc]
* NOTE, no dim name all the dimension size
[vargn]: name of the variable in the graph
[min]: minimum value for the extra variable
[max]: maximum value for the extra variable
[colbarn]: name of the color bar
[fmtcolorbar]: format of the numbers in the color bar 'C'-like ('auto' for %6g)
[orientation]: orientation of the colorbar ('vertical' (default, by 'auto'), 'horizontal')
[varu]: units of the variable
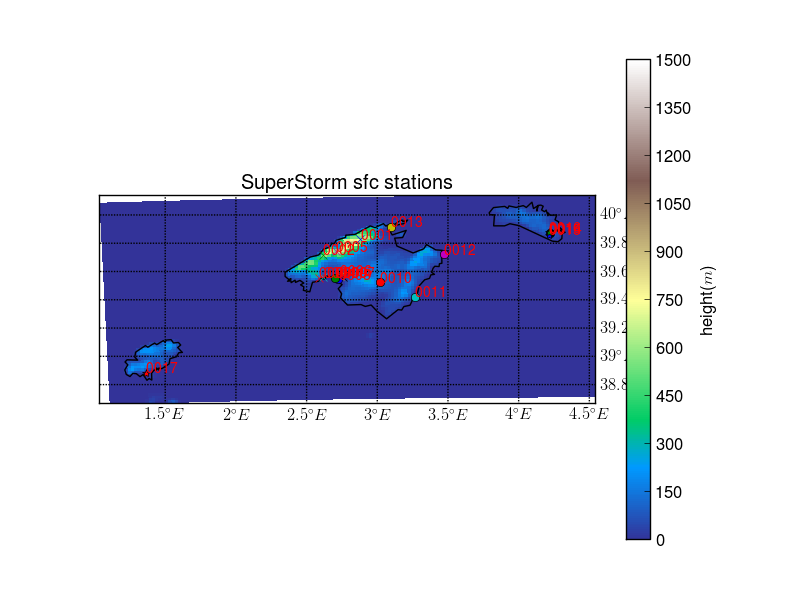
$ python ${pyHOME}/drawing.py -o draw_points -S 'SuperStorm/tslist.dat,#,3,2,1:SuperStorm|sfc|stations:auto:cyl,i:labelled,10,r,None:auto:None:0|12:png:stations_loc:True' -f 'geo_em.d02.nc,XLONG_M,XLAT_M,HGT_M,Time|0@west_east|30;180;1@south_north|175;255;1,height,0.,1500.,terrain,auto,auto,m'